
Insights are built from recorded meetings. A team that captures leads but never records conversations will see activity counts and little else. The richer views — topics, objections, sentiment — need transcripts to work from.
Reading the team's activity, then the meeting intelligence behind it
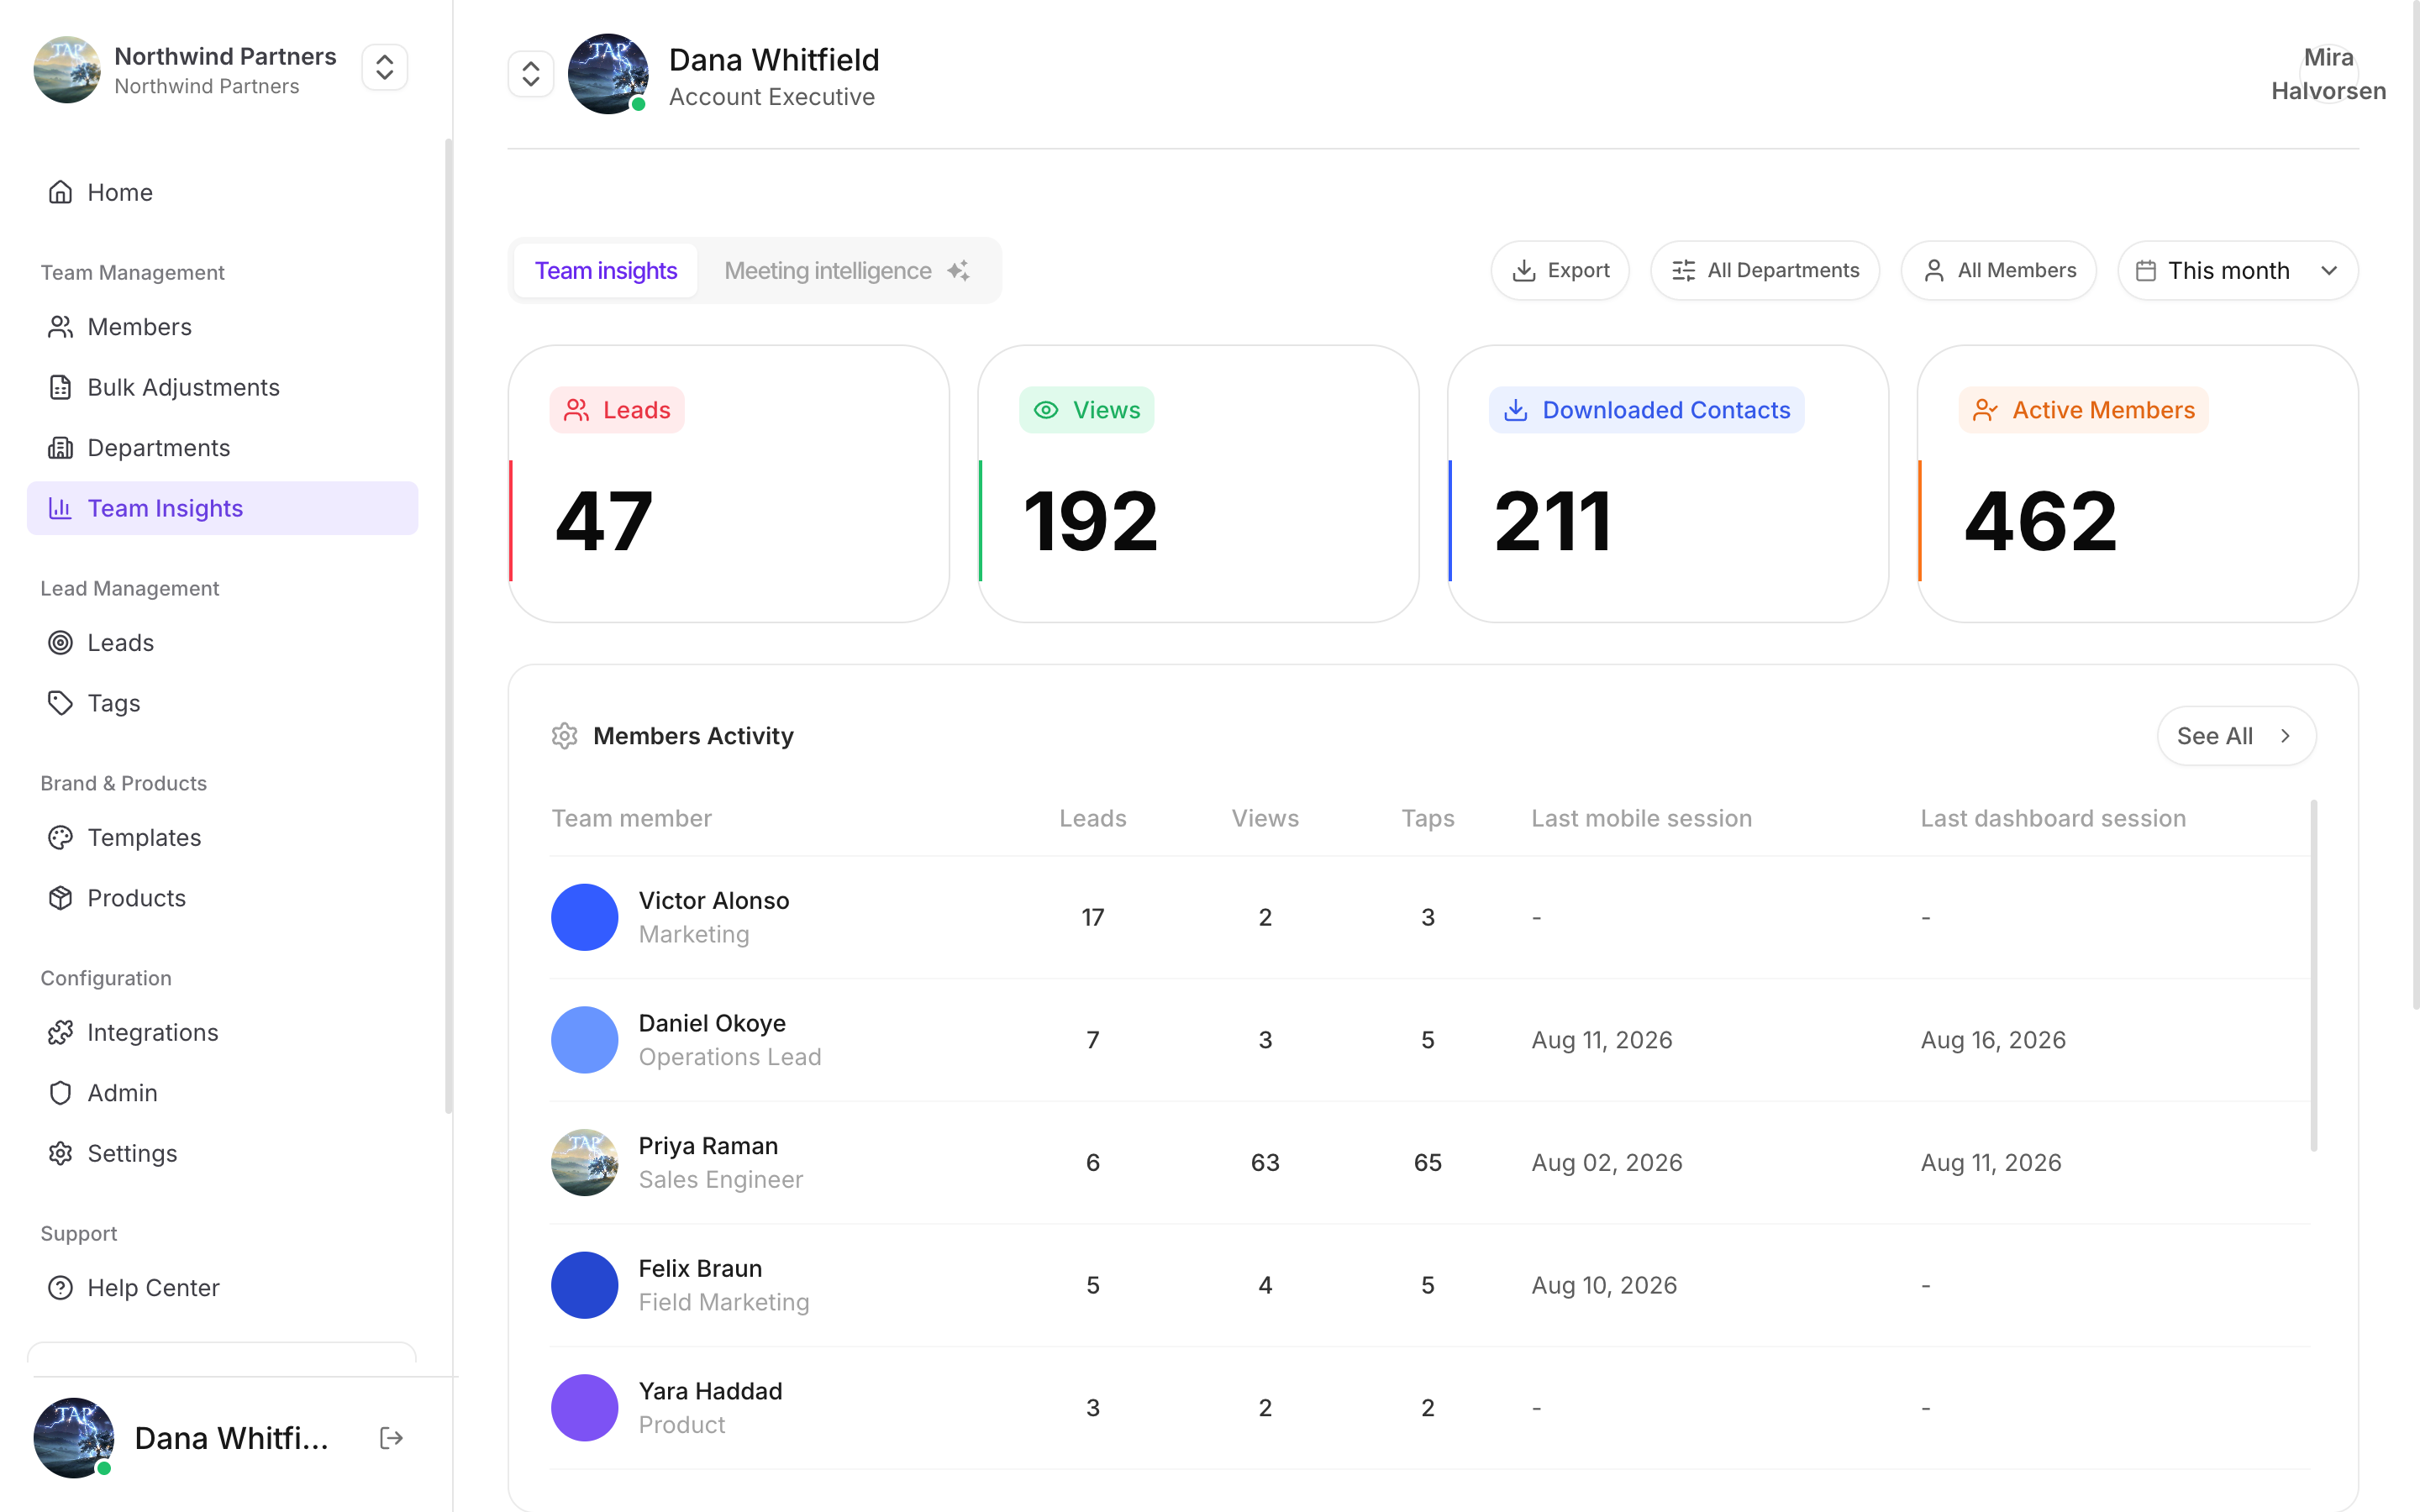
The top row is the whole team at a glance
The headline numbers
Leads and connections are counted separately. A lead is someone your team captured — through the capture form or the card scanner. A connection is a link between two Tap users who connected in the app. They used to share a count, which inflated both the totals and the acceptance rate; each connection is now counted once per relationship, and captured leads have their own number.Figures for periods before September 2026 were produced the old way, so a long comparison range can show a step change that is a counting fix rather than a drop in activity.
Notes
Two widgets read what your reps write and record on leads:- Notes — how many notes were written this month, and how many need attention. Each flagged note carries a reason: Unanswered (a note promised something and nothing has been logged since), Risk (several notes on one account say the deal is in trouble), or Competitor (a competitor is being named). See all lists every flagged note, and each flag opens the notes behind it.
- Note themes — what the notes are about, grouped by meaning rather than keyword. Each bar is coloured by how the notes read: positive, neutral, or negative. Themes appear once there are enough notes in the period.
Lead quality
Two cards show how your team answered the lead qualifiers:- Buying Role — how many decision makers you met, and the split across influencers, end users, gatekeepers, and leads marked not relevant.
- New vs Current Business — how many leads are new, existing, or returning.
Choosing a period
Every view is scoped to a date range, and each headline number is compared against the equivalent preceding period, so you see direction rather than just magnitude.What’s in each view
Members
Activity per person — leads captured, notes written, and when each member last used Tap.
Topics and objections
What conversations are actually about, and what’s standing in the way.
Action completion
Who closes the loop on what they promised, and who doesn’t.
Profile activity
Which profiles are being viewed and tapped — useful for judging whether a template change helped.
Notes
What your reps are writing and recording on leads, how many need attention, and the themes running through them.
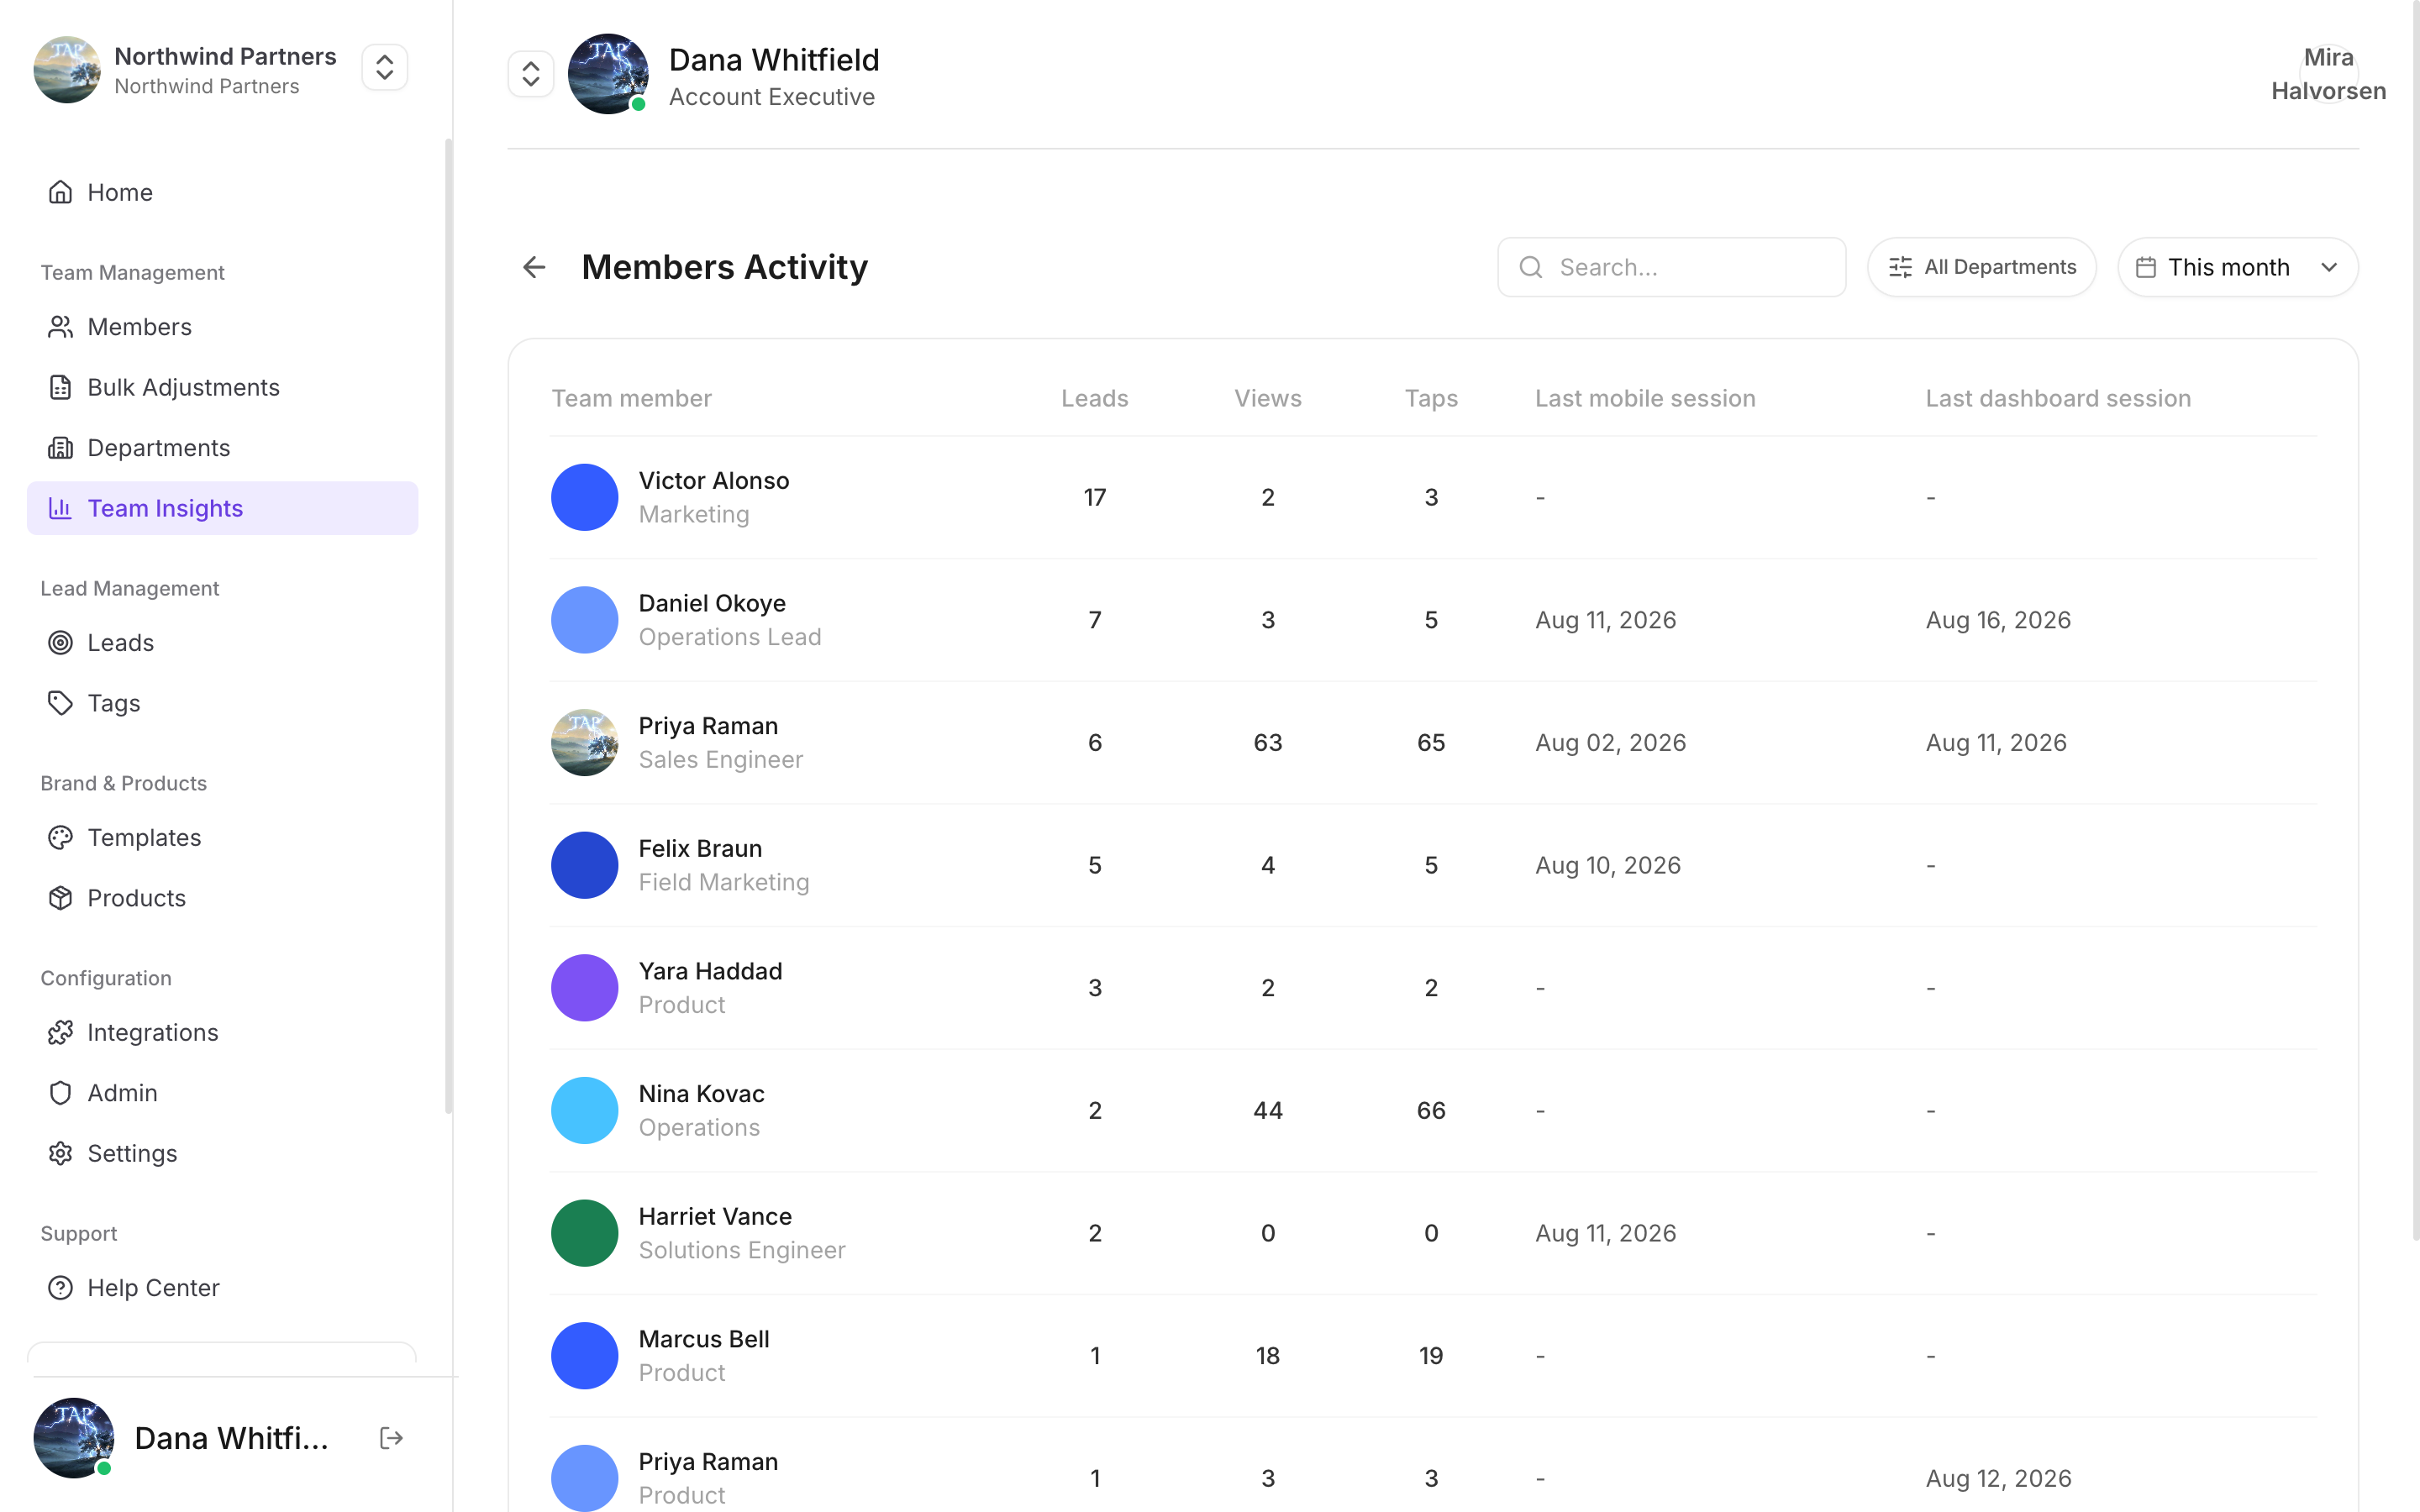
Profile activity — which cards are actually being seen
Headline numbers
The overview leads with meeting volume over time, your most recent meetings, and the accounts appearing most often in conversations. Two views deserve particular attention:- Sentiment trends — how the tone of conversations is moving. A steady decline usually shows up here before it shows up in your pipeline.
- At-risk accounts — accounts whose conversations have turned negative or gone quiet. This is the list worth reading every week.
Reading insights well
Volume is an input, not an outcome
Volume is an input, not an outcome
More meetings isn’t automatically better. Read volume alongside sentiment and follow-up completion — a rep doing half the meetings and closing every loop may be outperforming one doing twice as many badly.
Objections are the most actionable view
Objections are the most actionable view
A recurring objection is either a real product gap or a positioning failure. Either way it’s fixable, and it’s cheaper to fix once centrally than to let thirty reps improvise around it.
Small samples mislead
Small samples mislead
A topic appearing in three conversations is noise. Wait for enough volume before restructuring your pitch around a pattern.
Don't rank people on capture count alone
Don't rank people on capture count alone
Territories and events differ enormously. Someone working a quiet regional show can’t match someone at a flagship conference, and treating that as performance breeds gaming rather than improvement.